
Five Years of Data Show: Our Street Safety Projects are Making a Difference

Five Years of Data Show: Our Street Safety Projects are Making a Difference
By Julia Malmo

Ever wonder about the effectiveness of projects after they go into the ground? Us, too!  

That’s why, in 2017, we launched the Safe Streets Evaluation Program to help project teams understand whether a transportation safety project’s design is effective, and where there might be opportunities to adjust the design if not. Project evaluation data can also be combined across projects to help the SFMTA track the effectiveness of a certain type of safety improvement, which can in turn streamline the design of future projects. The Safe Streets Evaluation Program helps us work towards achieving Vision Zero, an initiative to prioritize street safety and eliminate traffic deaths in San Francisco.  

This week, we’re looking back on five years of data gathered through our Safe Streets Evaluation Program with the “2022 Safe Streets Evaluation Summary,” an interactive website summarizing the results of 18 bicycle, pedestrian and traffic safety projects implemented since 2017. 

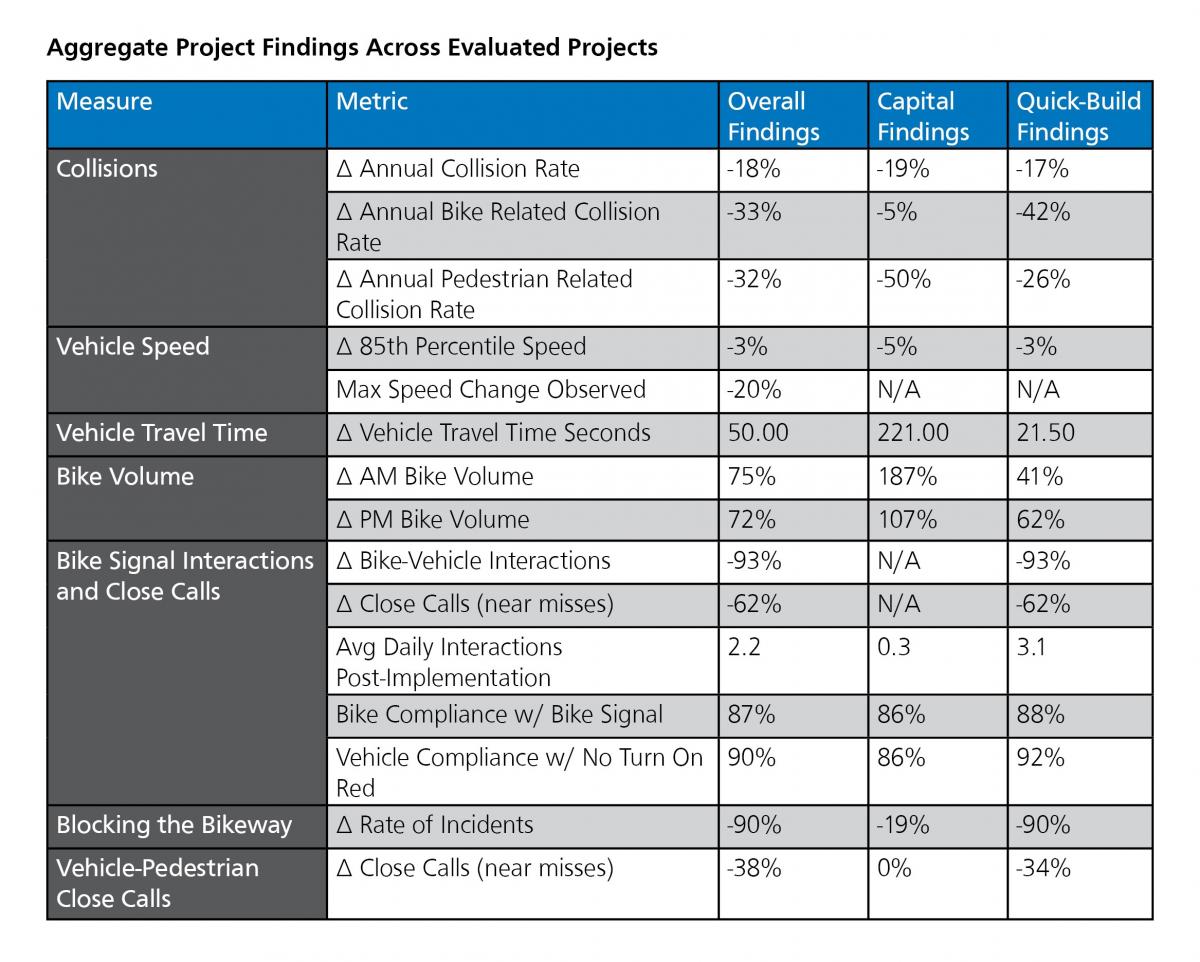
Each of the 18 projects evaluated in the summary report added significant safety upgrades to the streets. Some introduced vehicle travel lane removals (road diets), separated bikeways, separated bike signals, or left-turn traffic calming devices. Others brought general improvements for pedestrians at intersections including pedestrian signal improvements, daylighting (red zones at intersections) and upgraded crosswalks. For every project, the SFMTA drew on a wide range of data—from project-specific observations, to police reports, to speed data—to create a comprehensive view into its’ effectiveness. 

An infographic displaying the project names, key design element, and results. In the lefthand column, under “Inventory” the following projects are listed: 7th Street, 8th Street, Folsom Streetscape, Golden Gate Avenue, Leavenworth Street, Turk Street, Central Embarcadero, Valencia Street, 6th Street, Safer Taylor Street, Indiana Street, California Street, Page Street, Fell Street, Polk Street, Second Street, Masonic Avenue, Left-Turn Safety. In the center column, under “toolbox,” the following elements are listed: Road lane reductions, separated bikeways, bike signals, pedestrian upgrades, left-turn traffic safety. In the righthand column, under “results”, the following findings are listed: Collisions decreased by 18%; 85th percentile speeds decreased by 3%; bicycle volumes increased up to 75%; vehicle-bike interactions at signals decreased by 93%; vehicles blocking the bike lane decreased by 90%; pedestrian-vehicle close calls decreased by 38%; vehicle travel time increased an average of 50 seconds for 7.3 miles of road lane reductions; left turn vehicle speeds decreased by 17%

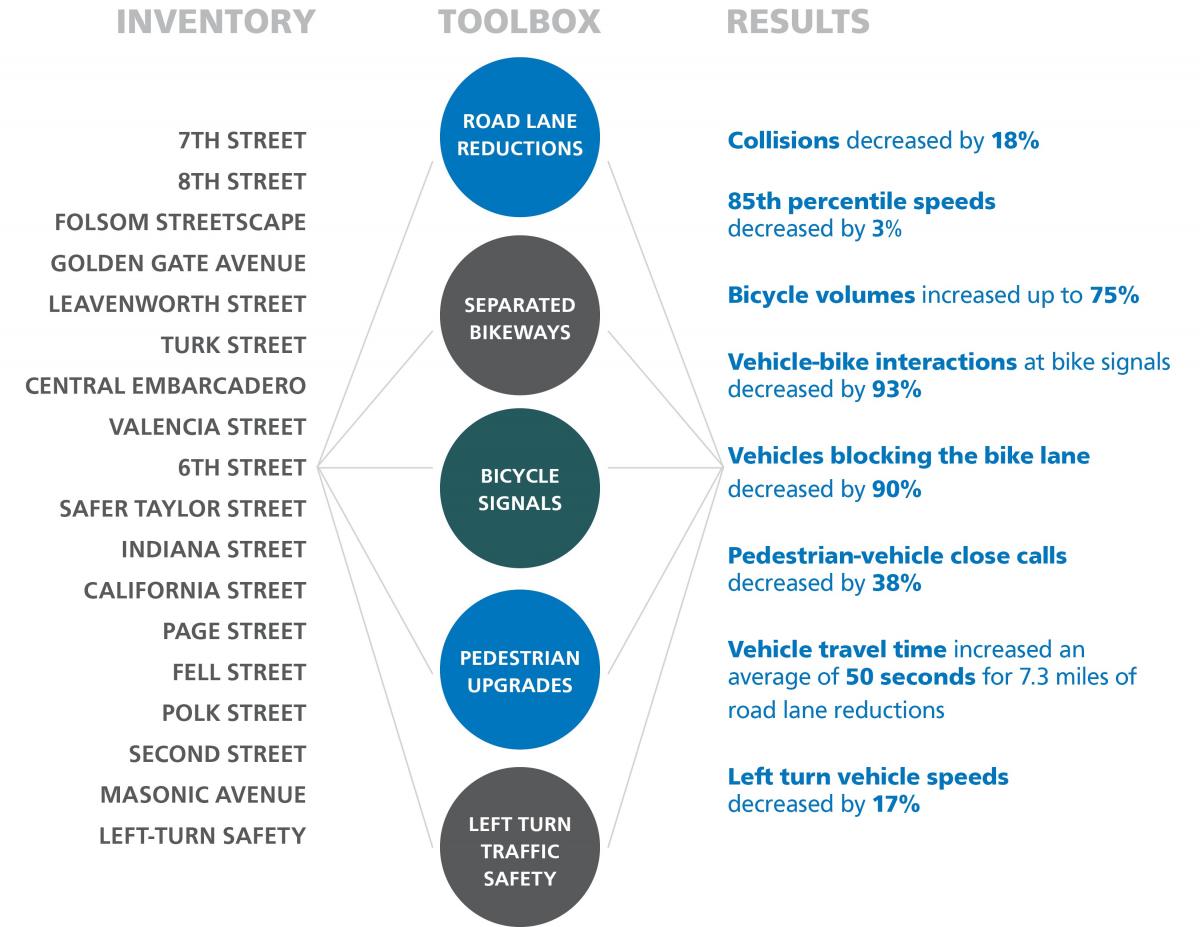
The evaluation report indicates that the SFMTA’s safety tools are working together to create safer environments for all modes of transportation on city streets. 

You can dig into the whole set of outcomes on the website, but here are some highlights:  

  • Within the projects evaluated, annual collision rates decreased by 18%  

  • Bicycle-related collision rates decreased by 33% and pedestrian-related collision rates decreased by 32%   

  • Bicycle volumes on streets that received bicycle improvements increased up to 75% in the morning peak (8 AM to 10 AM) commute times, with similar growth in the afternoon/evening peak (4 PM to 6 PM) commute times.   

  • Thanks to protected bikeways, the rate of incidents of vehicles blocking the bike lane decreased by 90%.   

  • Close calls or near misses between pedestrians and drivers decreased across evaluated projects by 38%.  

  • Several projects in under-served communities such as the Bayview and Tenderloin are helping to address historic inequities and under-investment in these neighborhoods.   A table titled “Aggregate Project Findings Across Evaluated Projects”. At the top of the table, a blue bar lists out the column titles: Measure; Metric; Overall Findings; Capital Findings; Quick-Build Findings. In the Collisions section, the following sub-categories are evaluated. For Annual Collision Rate: Overall findings show an 18% reduction; Capital Findings show a 19% reduction; Quick-Build Findings show a 17% reduction. For Annual Bike-related collision rate: Overall findings show a 33% reduction; Capital findings show a 5% reduction; Quick-Build findings show a 42% reduction. For Annual Pedestrian Related Collision Rates: Overall findings show a 32% reduction; Capital findings show a 50% reduction; Quick-Build findings show a 26% reduction. In the Vehicle Speed section, the following sub-categories are evaluated. For 85th Percentile Speed: Overall findings show a 3% reduction; Capital findings show a 5% reduction, and Quick-Build Findings show a 3% reduction. For Max Speed Change Observed: Overall findings show a 20% reduction, and no data is present for either Capital Findings or Quick-Build Findings. For Vehicle Travel Time/Vehicle Travel Time in Seconds: Overall findings show 50.00; Capital Findings show 221.00; Quick-Build Findings show 21.50. For the Bike Volume section, the following sub-categories are evaluated. For AM Bike Volumes: Overall Findings show a 75% increase; Capital Findings show a 187% increase; Quick-Build findings show a 41% increase. For PM Bike Volumes: Overall Findings show a 72% increase; Capital Findings show a 107% increase; Quick-Build Findings show a 62% increase. In the Bike Signal Interactions and Close Calls section, the following sub-categories are evaluated. For Bike-Vehicle interactions: Overall findings show a 93% reduction; Capital findings show no data; Quick-Build findings show a 93% reduction. For Close Calls (near misses): Overall findings show a 62% reduction; Capital findings show no data; Quick-Build findings show a 62% reduction. For Average Daily Interactions Post-Implementation: Overall Findings show 2.2; Capital Findings show 0.3; Quick-Build Findings show 3.1. For Bike Compliance w/ Bike Signal: Overall findings show 87% compliance; Capital Findings show 86%; Quick-Build Findings show 88% compliance. For Vehicle Compliance w/ No Turn On Red: Overall findings show 90% compliance; Capital Findings show 86% compliance; Quick-Build findings show 92% compliance. In the Blocking the Bikeway section, Rates of Incidents was evaluated. Overall Findings show a 90% reduction; Capital Findings show a 19% reduction; Quick-Build Findings show a 90% reduction. In the Vehicle-Pedestrian Close Calls Section, Close Calls (near misses) were evaluatd. Overall Findings show a 38% reduction; capital findings show a 0% reduction; quick-build findings show a 34% reduction

The Safe Streets Evaluation team will continue to think creatively about how to build on the evaluation work and use it to inform our current and future projects, programs, and practices through developing a publicly accessible database of all Safe Streets Evaluation data and finding better ways to evaluate project outreach efforts. 

View the 2022 Safe Streets Evaluation Summary 

Learn more about the SFMTA Safe Streets Evaluation Program: SFMTA.com\safestreetsevaluation 


Published November 08, 2022 at 04:56AM
https://ift.tt/Mh4uUsf

Comments

Popular posts from this blog

Show HN: Launch VM workloads securely and instantaneously, without VMs https://ift.tt/2QwJ1Kd

Show HN: Launch VM workloads securely and instantaneously, without VMs Hello HN! We've been working on a new hypervisor https://kwarantine.xyz that can run strongly isolated containers. This is still a WIP, but we wanted to give the community an idea about our approach, its benefits, and various use cases it unlocks. Today, VMs are used to host containers, and make up for the lack of strong security as well as kernel isolation in containers. This work adds this missing security piece in containers. We plan on launching a free private beta soon. Meanwhile, we'd deeply appreciate any feedback, and happy to answer any questions here or on our slack channel. Thanks! April 29, 2021 at 07:50AM

Women Pioneers at Muni: Adeline Svendsen and Muni’s First Newsletter

Women Pioneers at Muni: Adeline Svendsen and Muni’s First Newsletter By Jeremy Menzies To close out Women’s History Month, here’s a look back at one woman whose work to bring Muni staff together in the late 1940s created a legacy that lives on to this day. Adeline “Addy” Svendsen was founding editor of Muni’s first internal newsletter, “ Trolley Topics .” Adeline Svendsen sits at her desk in the Geneva Carhouse office building in this 1949 shot. Trolley Topics was a new venture when it started in February 1946. As Svendsen wrote in the first issue it was created, “to bring a little fun, a little news, and a lot of good will to all our fellow employees in the Railway.” Just two years prior in 1944, Muni merged with the Market Street Railway Company, expanding the small municipal operation into the largest transit provider in the city with hundreds of employees, vehicles of every shape and size, and dozens of facilities scattered across town. The newsletter was meant to help unite ...

Show HN: Comment on live websites just like you comment on Google Docs/Figma https://ift.tt/GRhrjX0

Show HN: Comment on live websites just like you comment on Google Docs/Figma I'd love your feedback on this new JS plugin we launched. With this, you can comment on live websites just like you comment on Google Docs or Figma. You can use is to get Copy or UI feedback right on the website you are building. Feedback can be provided in rich formats like audio and video. You can get started by installing a JS tag in the footer of the website. You can then turn the review mode on or off on demand by adding “?review=true” to the URL. Demo video (43s): https://www.youtube.com/watch?v=cdnfBEw8TfI Demo video: https://www.youtube.com/watch?v=h6vxzXJuh8o https://ift.tt/ocLpdEu October 26, 2022 at 02:18AM